Andrew Stokes points to a life hack that helps IELTS candidates optimise their preparation time.
Background
‘Keeping a journal is a great way to build better habits,’ says LifeHack.com, ‘as it forces you to be aware of your actions and behaviors. If you’re looking to watch what you eat, keeping a food diary is a great way to stay paying closer attention.’ Exercise sites tell us to keep a journal too; Buddhists recommend a gratitude journal. I’d like to suggest that we ask IELTS candidates to keep a detailed study journal.
Why? Because the stats show us that people preparing for IELTS don’t spend their time in the optimal way. With over four million sessions a year, Road to IELTS produces a mountain of data, and it’s clear that students spend too much time on the skills they are better at, and not enough time on the skills they struggle with. Like most of us, they want to study — but not too hard.
However, simply recording what they’ve done in a journal is unlikely to help a learner allocate their time effectively unless there is a mechanism for the journal to give feedback. Let’s look at how this can be done.
Method
Step one is for the student to determine their strong and weak areas. This can be done using the Study Planner available here, through taking a mock test in each skill or through a counselling session with the teacher.
Step two is to decide, based on the outcome of step one, where time is best spent. So, for example, a candidate might decide to spend 50% of their time on Writing, 20% on Listening, 20% on Speaking and 10% on Reading.
Step three is to draw up a schedule. I recommend doing this in Google Sheets. That makes it always available, and easy to fill in. Make eight columns: Date, Skills focus, Activity, Reading, Writing, Speaking, Listening, Notes (where you might record your feelings about your day’s study activities). In the skills columns you simply write how many minutes you spent each day on that skill. In simplified form it looks like this:

Output
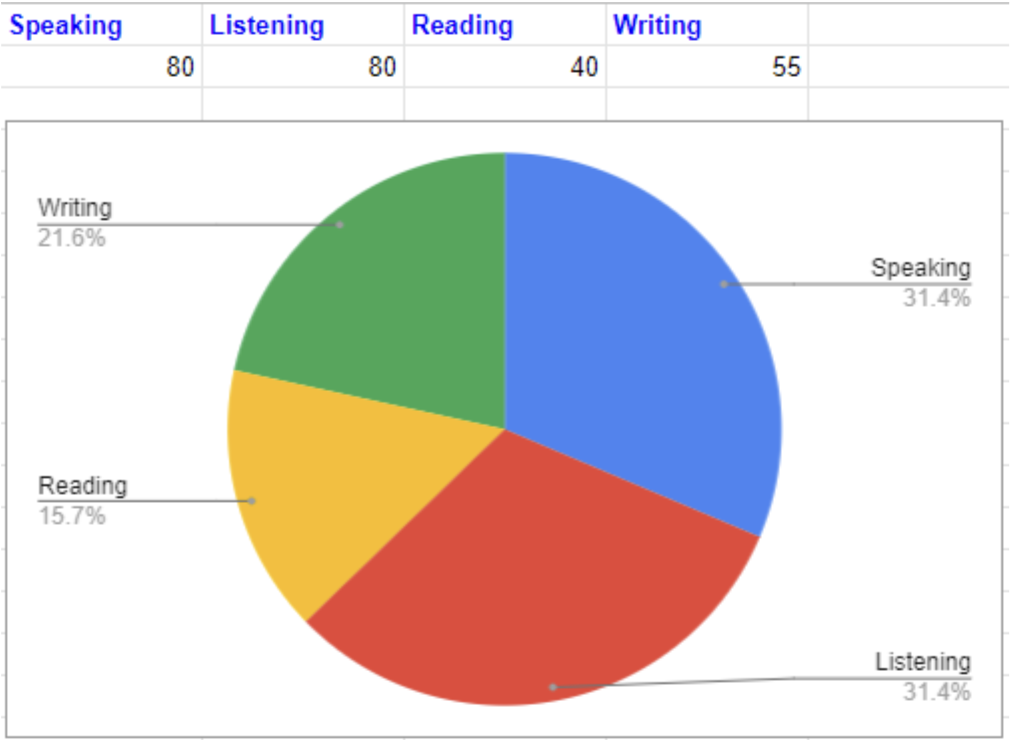
Looking at the figures, it’s clear that the totals for each skill do not correlate well with the planned allocation of time. But — and this is the ‘LifeHack’ — how much clearer it is when we link these figures to a second sheet and graph them.

This visual representation immediately shows the student that they are not spending nearly enough time on Writing and they are spending far too much time on Listening and Speaking. Whether they do anything about this is another matter — the point is that the graph means they can’t hide from it.
Notes:
It’s easy to create a pie chart in Google Sheets. Here’s just one explanation on Youtube. There are lots of others.
Further reading:

